
Case study
 Pocket network case study
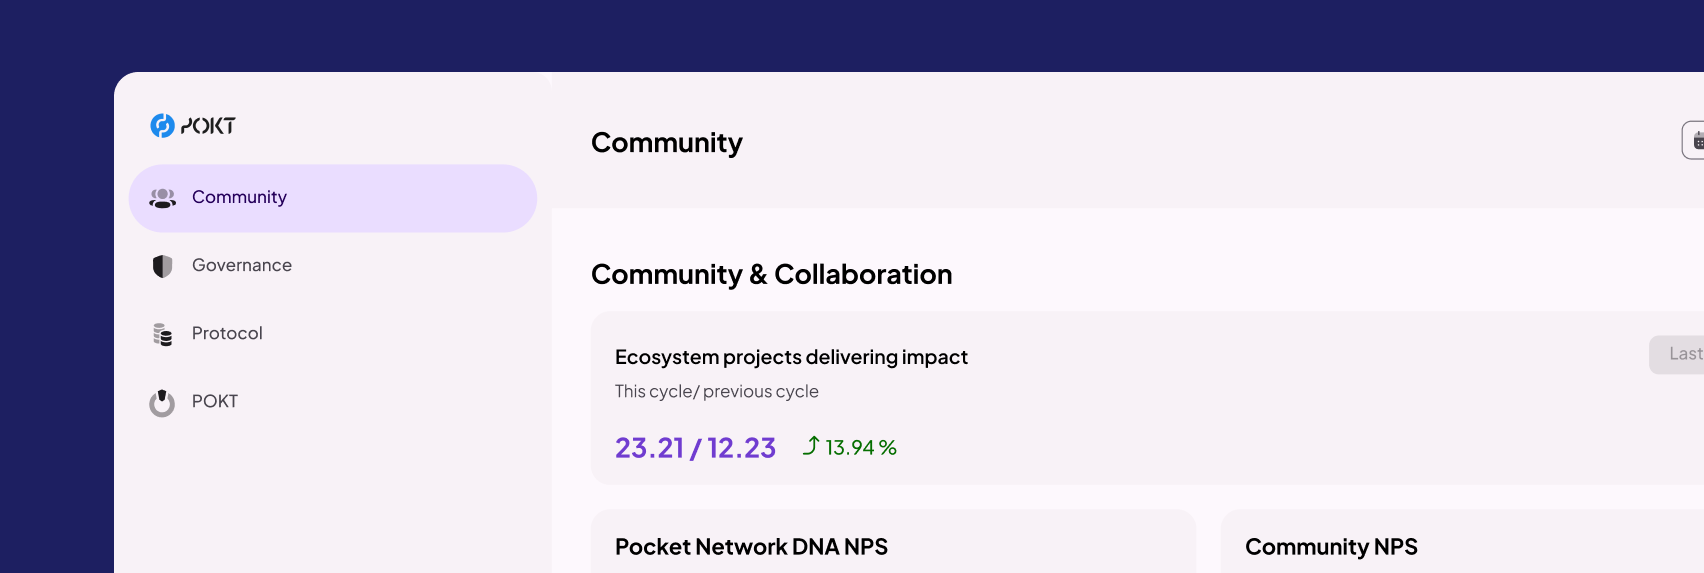


Pocket Network Ecosystem Metrics Dashboard
Dive into an immersive journey where innovation meets practicality in our latest case study featuring the Ecosystem Metrics Dashboard, exclusively curated for the Pocket Network. In a symphony of creativity and technological prowess, our dedicated teams at TogetherCrew and Microflow have woven a dashboard that echoes the values of transparency, inclusivity, collaboration, and adaptability central to the Pocket Network's mission.

-
Year
2023
-
Client
Pocket Network - RnDAO - Microflow
-
Client's origin
Multi locations
-
Services
Product design
-
Project
Pocket Network Ecosystem Metrics Dashboard
Description
Dive into an immersive journey where innovation meets practicality in our latest case study featuring the Ecosystem Metrics Dashboard, exclusively curated for the Pocket Network. In a symphony of creativity and technological prowess, our dedicated teams at TogetherCrew and Microflow have woven a dashboard that echoes the values of transparency, inclusivity, collaboration, and adaptability central to the Pocket Network's mission.
Project Background:
Pocket Network is a trailblazer, striving to redefining the landscapes of Web3 node infrastructure by initiating a multi-chain relay protocol. Our collaborative mission focused on leveraging the potent capabilities of the Pocket Network, amplifying its impact through a meticulously crafted dashboard that would become an epitome of clarity, utility, and user-centric design.
Understanding User Needs and Objectives:
Research and Discovery (Week 1-2)
Our initial phase was marinated in extensive research and thoughtful discovery. Conversations were imbued with curiosity as we sought to grasp the nuanced requirements, unraveling the layers of expectation and necessity from the Pocket Network team.
What kind of data was essential?
Who would be the primary users of the dashboard?
What were the key objectives that the dashboard should achieve?
Through workshops and interactive sessions, we delved deeply into aligning the project's vision with actionable insights and user stories that would form the bedrock of our design philosophy.
Crafting the User Experience (UX Design: Week 3-5 & 9-10)
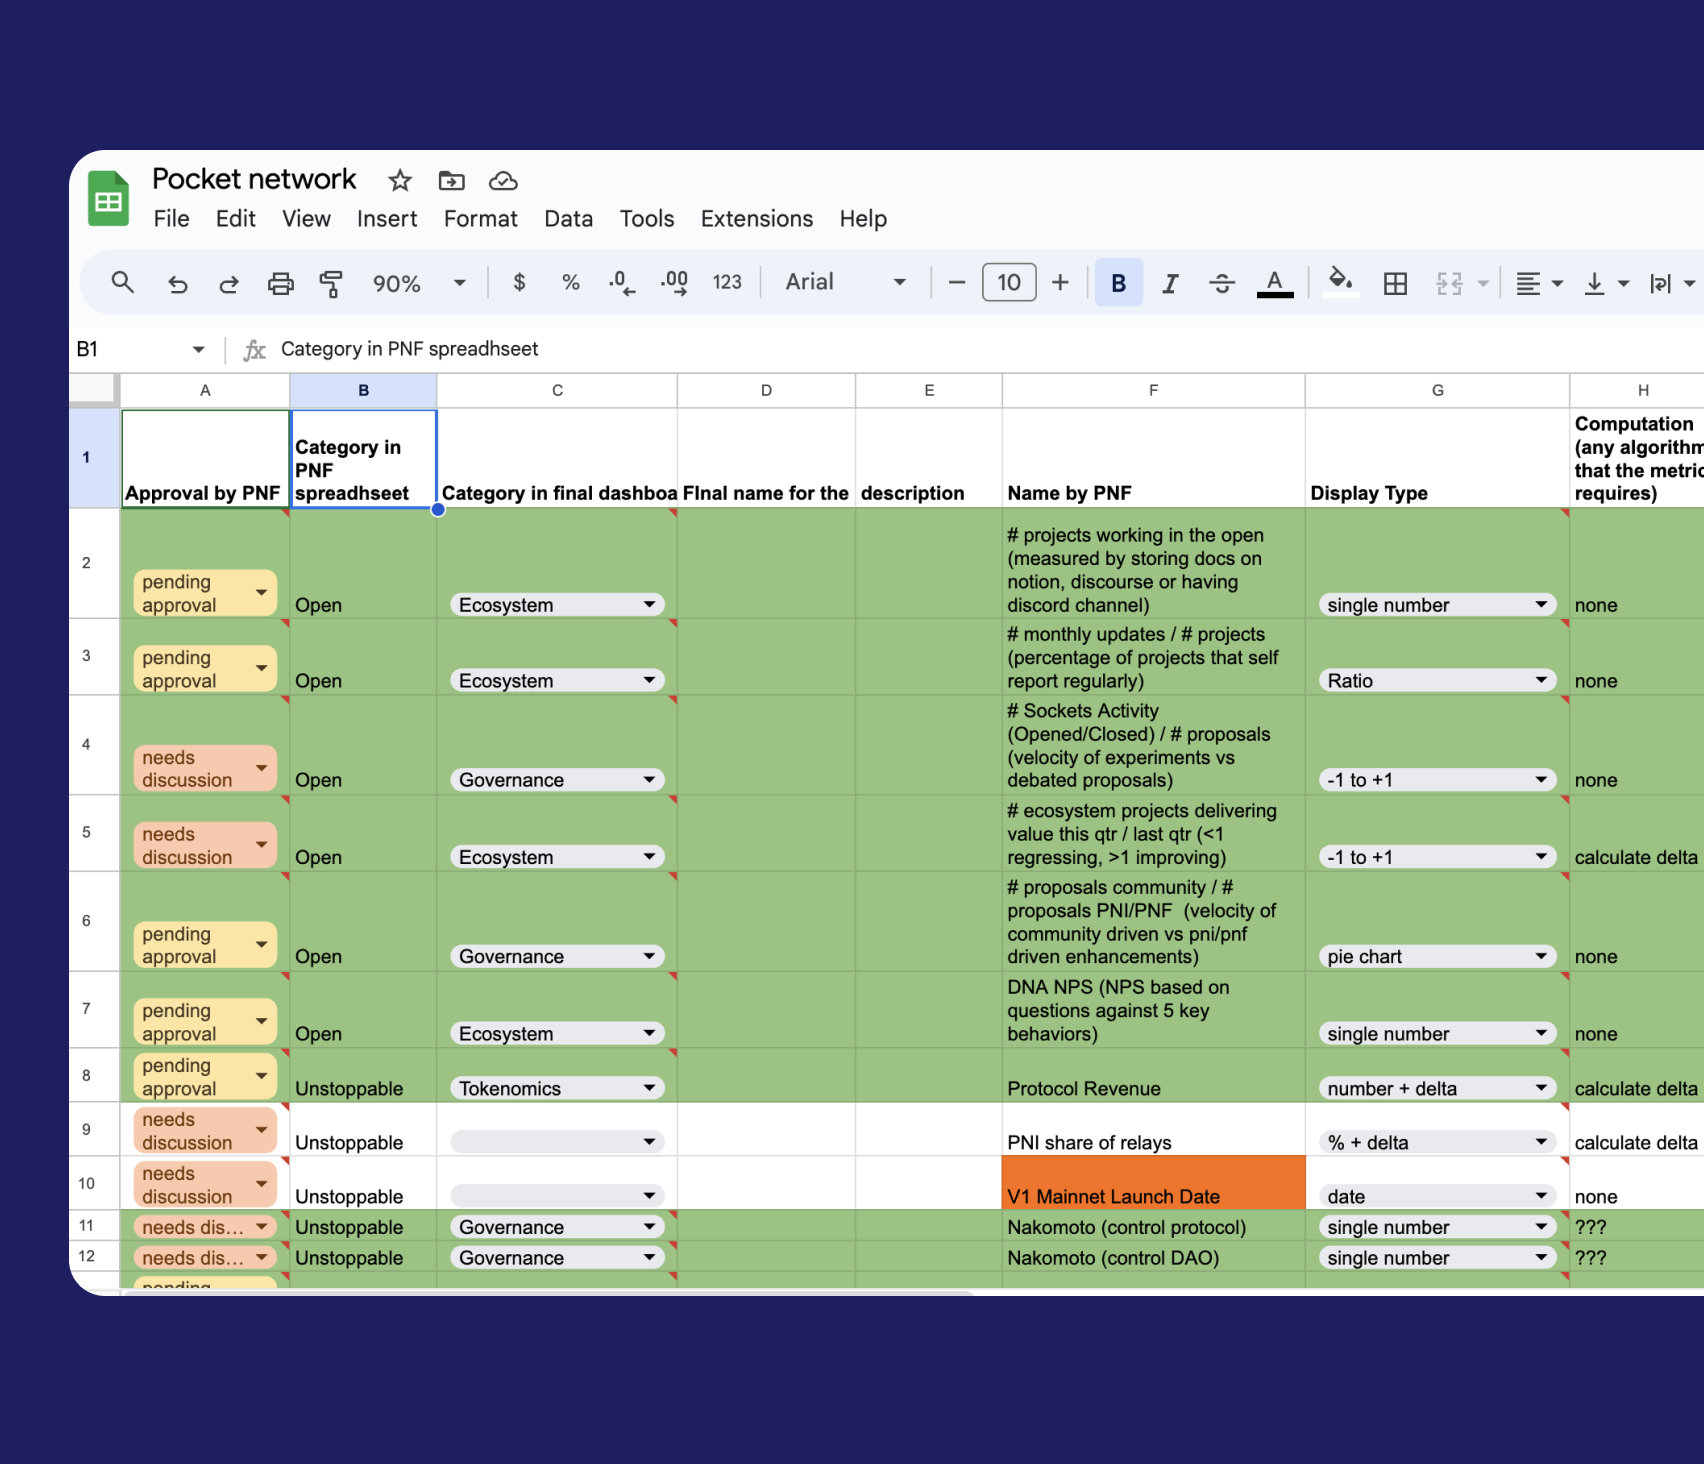
Foundation: Feature Requests and Data
Informed by a rich tapestry of feature requests and data, the design phase unfurled. Armed with insights and grounded in user needs, every decision, every creative exploration, was meticulously aligned with the aim to create a dashboard that was not only powerful in functionality but also a nexus of intuitive user experience and engagement.
Conceptualization and Exploration
Embarking on a journey, the design process embraced an open canvas of creativity. Directly leveraging feature requests and user data, initial concepts and design explorations were initiated, ensuring that the dashboard’s design was a harmonious intersection of user expectations and innovative design solutions.
Community Collaboration and Feedback Integration
The design didn’t remain ensconced within the realms of our creative chambers; it was brought into the light of community interaction and feedback. Sharing the initial concepts with the Pocket Network team and the broader community opened avenues for enriching feedback, ensuring the dashboard evolved, sculpted by the collective wisdom and insights of its future users. Each iteration, each enhancement, bore the imprint of user needs and community insights, ensuring the Ecosystem Metrics Dashboard wasn’t just a tool but a dynamic interface enriched by the community's collective intelligence and our unwavering commitment to design excellence.
Turning Visions into Reality
Backend Development (Weeks 2-8)
Parallel to the design odyssey was the backend development, a crucial pillar ensuring the dashboard’s functionality was as robust as its appearance. Efforts were directed towards establishing data source integration modules, defining statistical logic, and ensuring the seamless flow of data into the dashboard's visual embrace.
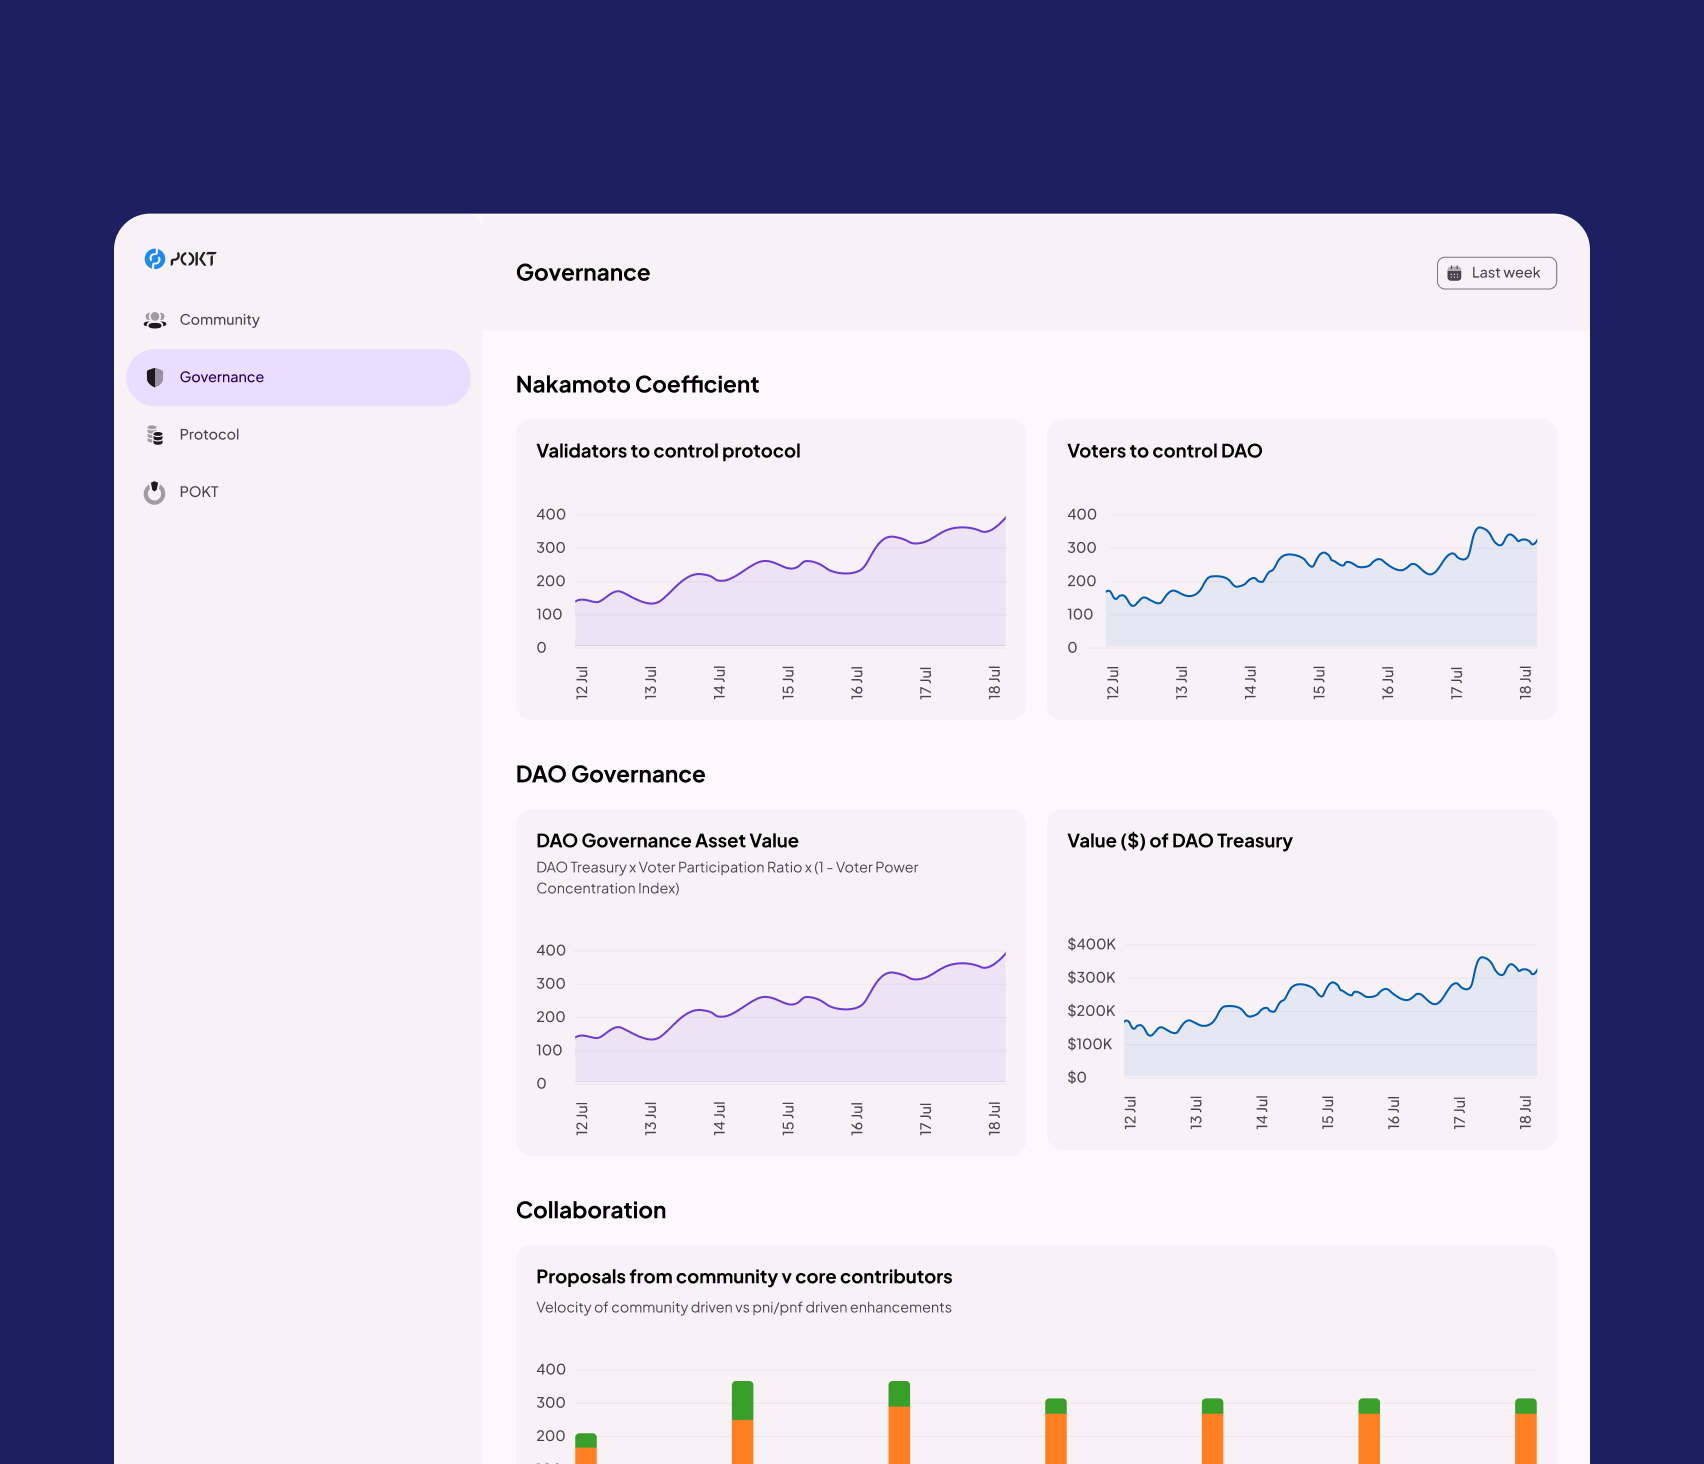
Frontend Development (Weeks 4-8)
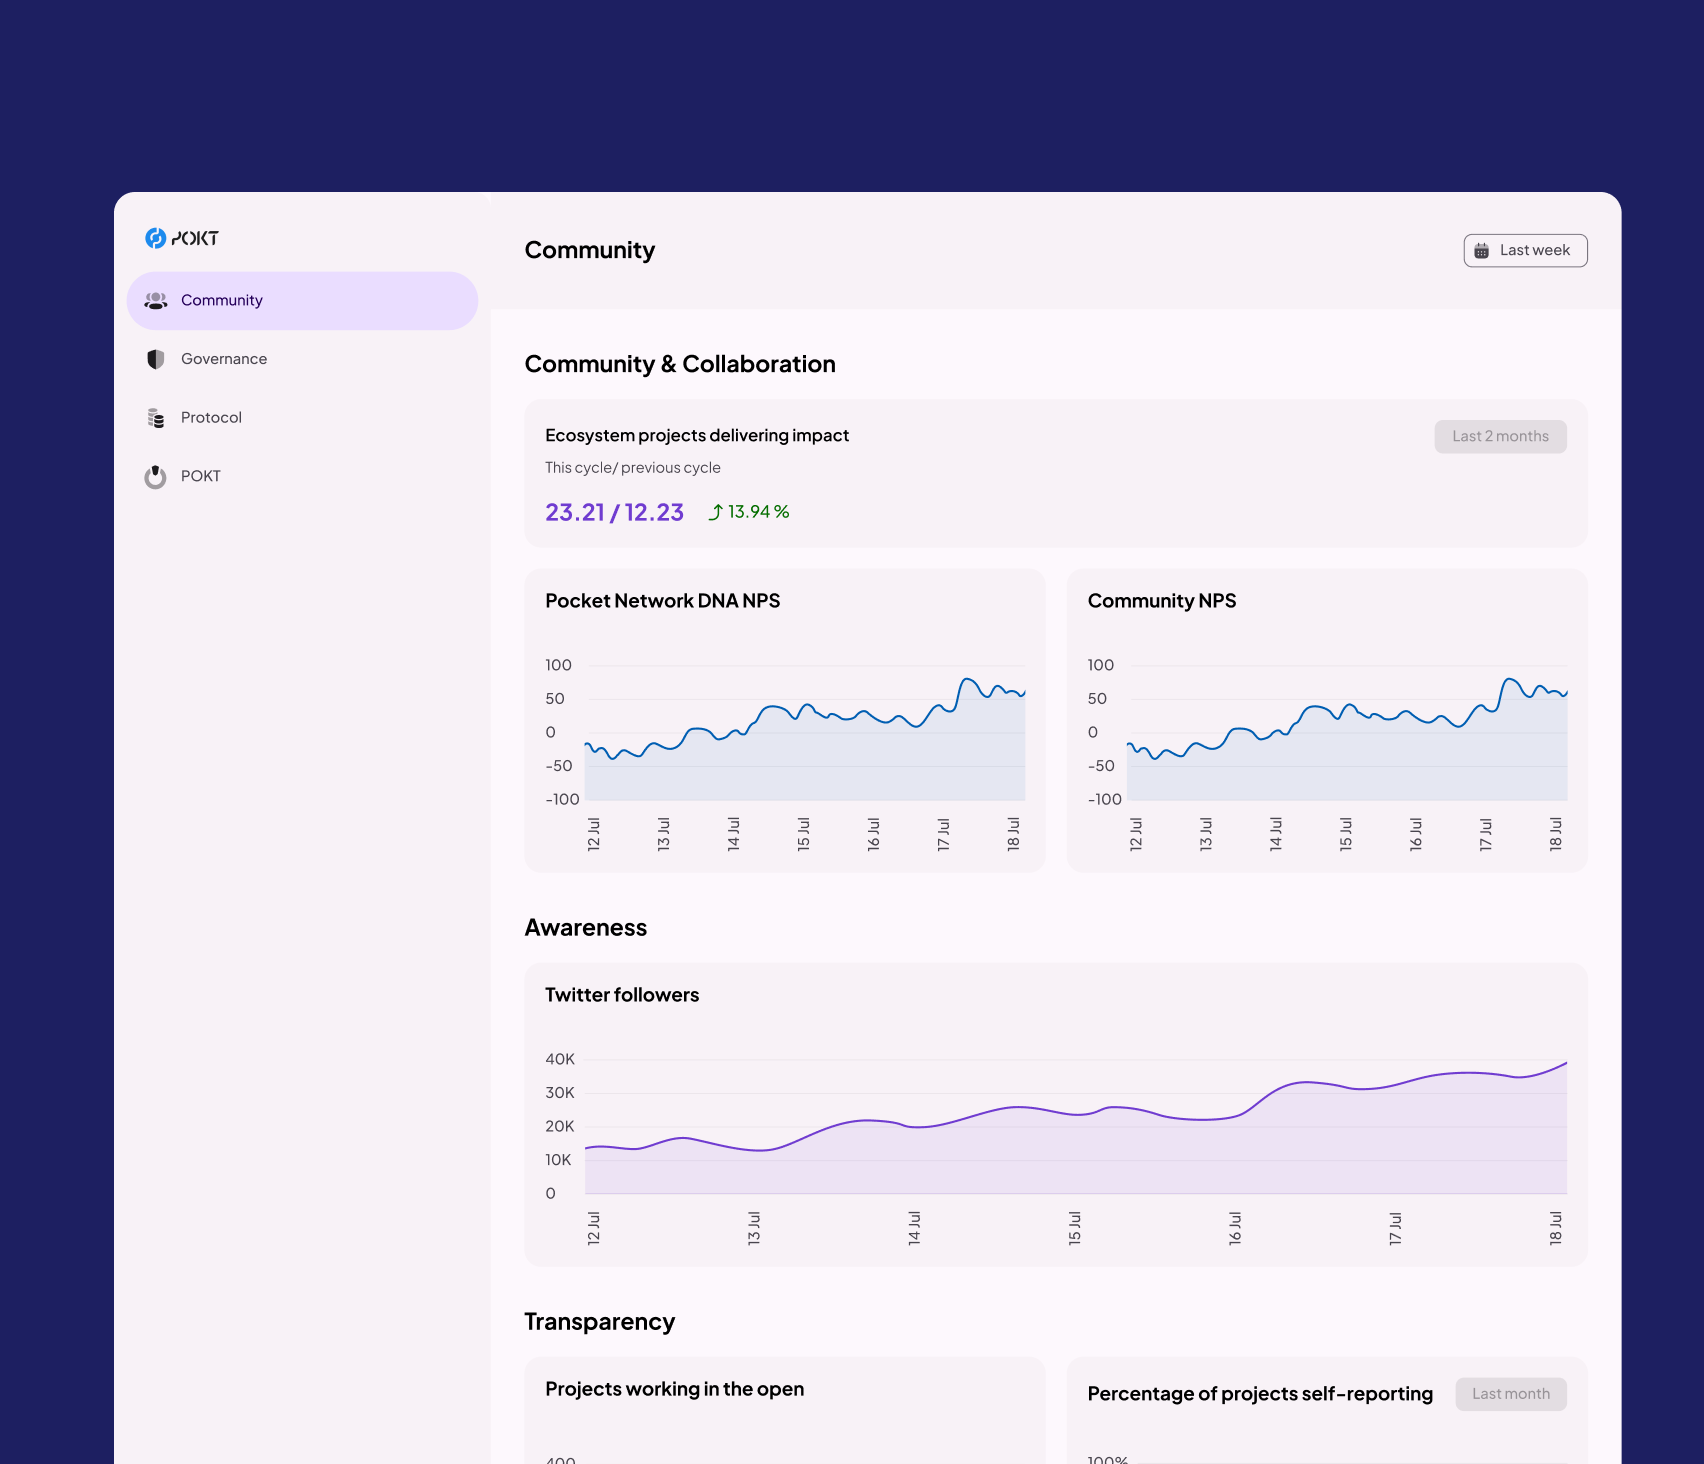
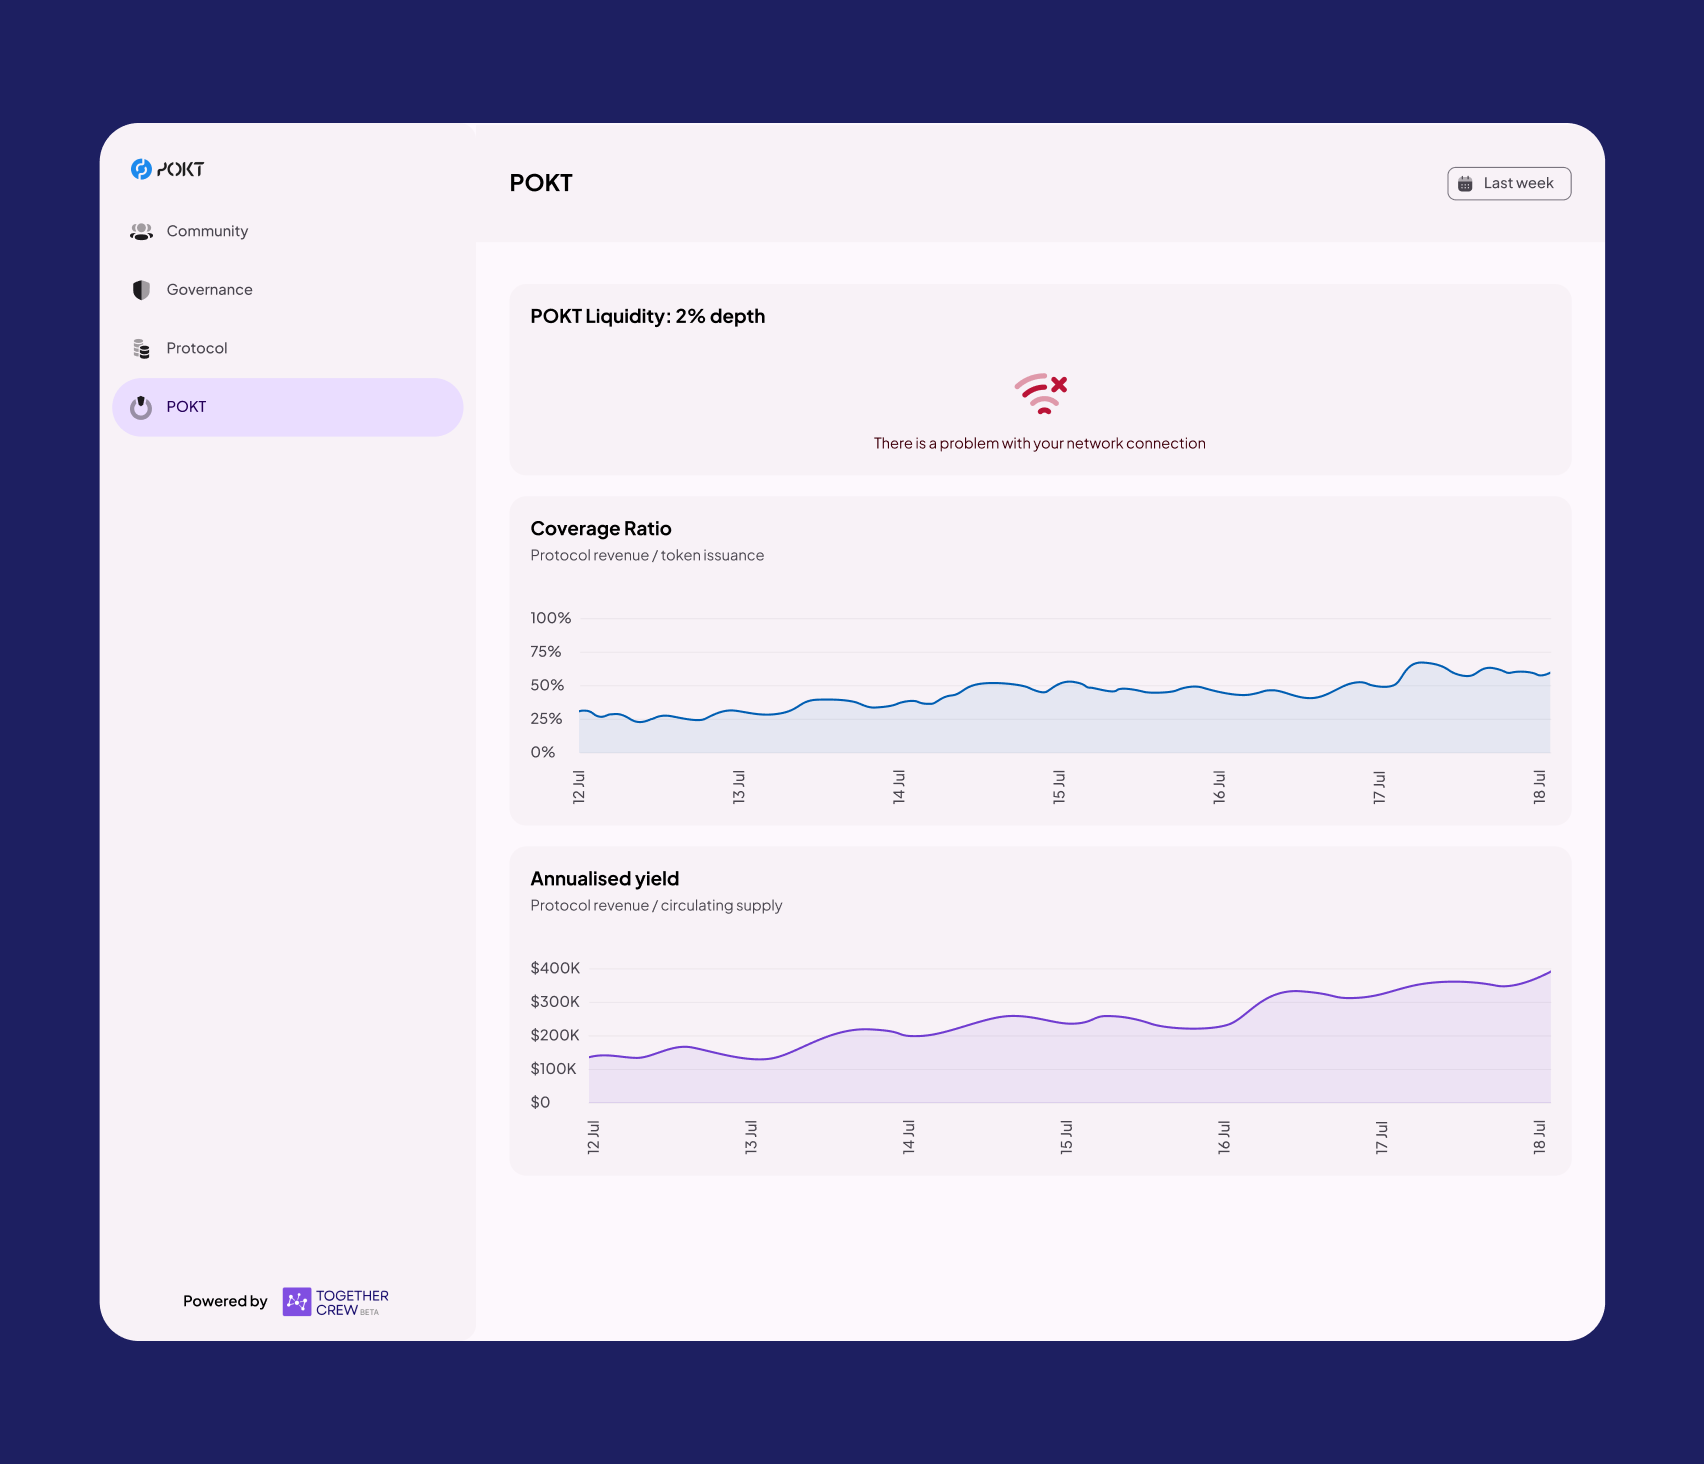
Our frontend development phase was where design met functionality. The vibrant visual elements, interactive charts, and intuitive layouts were brought to life, ensuring that every user interaction was smooth, meaningful, and insightful.
Quality Assurance and Testing (Weeks 3-9)
Perfection was pursued through rigorous testing phases where every element, every functionality, was put under the microscope of quality assurance. Bugs were hunted, and user flows were optimized to ensure that the dashboard stood as a paragon of reliability and excellence.
Conclusion: Crafting a Legacy of Impact
The journey of crafting the Pocket Network Ecosystem Metrics Dashboard was not just a project; it was a symphony of creativity, technology, and community collaboration. We didn’t just design a dashboard; we curated an experience, a bridge connecting the vibrant Pocket Network community with the wealth of multi-chain relay protocol insights, fostering an ecosystem imbued with knowledge, transparency, and collaborative evolution.